
Comparative Analysis of Phytosociology and Biodiversity Indices in the Ecosystems of Keibul Lamjao National Park, Manipur, India
*Corresponding address: boxenkambam9@gmail.com
Abstract
A comprehensive understanding of wildlife habitat's floral composition and quantitative characters is vital for its management. The study aimed to comprehend the phytosociology and diversity indices in significant ecosystem types of the Keibul Lamjao National Park (KLNP) Manipur, India. Zizania latifolia and Pinus kesiya were the most dominant species in the wetland and terrestrial ecosystems, respectively. The Shannon-Wiener's Diversity Index (H) in both the sites was in the range of 2.67-3.61, while the Dominance of Simpson's Index (D') was 0.87-0.96. The Species Evenness Index (E') value of 0.95 and 0.82 recorded in the two ecosystems indicates less variation among the species.
Keywords: Forest ecosystem, floating meadows, phumdi, plant community, species diversity
Introduction
The Indo-Burma biodiversity hotspots covering Cambodia, Lao PDR, Myanmar, Thailand, Vietnam, parts of southern China, and parts of north-eastern India is ranked among the top 10 hotspots for irreplaceability and one of the most biologically rich and highly threatened places on the globe, with only 5% of its natural habitat remaining. Among the diverse ecosystems of Indo-Burma biodiversity hotspots, the freshwater ecosystem is most vulnerable to human utility as these areas are thickly populated and vital for the livelihood of some of the region's most economically marginalized ethnic groups, resulting in adverse effects on biodiversity 1, 2. The principal threats to these delicate freshwater environments incorporate impractical resource extraction, changes to stream flow because of dam construction, and pollution. Loktak lake, the biggest freshwater lake in Northeast India, is a Ramsar site and supports rich biodiversity. Being socially, culturally, and economically important to the people of Manipur, the lake is a lifesaver for them. The southern part of the Loktak Lake, with 40 km² is protected as Keibul Lamjao National Park (KLNP) to conserve the globally endangered Rucervus eldii eldii. It is the only floating park in the world and the only natural habitat for the brow-antlered deer (Rucervus eldii eldii), locally known as Sangai. The park's unique character is floating meadows of varied thickness, locally called phumdi, a heterogeneous mixture of dead and decaying vegetation, a combination of soil and organic matter in various stages of decay.
In India, the loss of wetland ecosystems is mainly due to urbanization, land-use changes, runoff from agriculture, infrastructure development, pollution from industrial effluent, and climate change variability 3. This loss in wetland has resulted in an adverse impact on critical functions performed by wetlands 4. The decreasing thickness of phumdis has significant implications for the conservation of endangered Sangai, as the phumdi of thickness less than 1 m cannot bear the weight of Sangai. A comprehensive understanding of the vegetation composition of the park is essential for the conservation of Sangai. The prior investigation suggested changes in the plant species composition of the phumdi of the park 5. These alterations could be the result of changes in the park's hydrology and the extraction of plant species by neighbouring local communities. The wetland ecosystems are highly susceptible to environmental changes as environmental factors govern the wetland plant community structure 6, 7. The characters of wetland plant species are fast growth rates, high species richness, and manifest tolerance to various human-induced changes and micro-environmental conditions. Therefore the index of wetland health is often determined by the wetland vegetation composition. Understanding the spatial and temporal heterogeneity of wetland environments is a key to the fruitful preservation of wetlands due to the one-of-a-kind spatial mosaic of the wetland plant community 8. The floristic composition of the wildlife environment has a significant bearing on plant-animal association. This association is essential to comprehend the palatability of various grasses, herbs and legumes to different herbivores 9. Such investigation will help understand the forage prerequisite of deer, its feeding behaviour, and usage pattern of territory, impacting the primary productivity. Likewise, the information on floristic composition and quantitative characters of vegetation is significant for dealing with the park's management. It is imperative to understand different plant communities and their potential to provide habitat for the animal to make science-based management decisions for natural areas 10.
Despite the ecological importance of Keibul Lamjao National Park (KLNP), previous studies have largely focused on general floristic composition and habitat description, with limited emphasis on quantitative assessment of vegetation structure and diversity across different ecosystem types. Moreover, there remains a lack of detailed, spatially explicit phytosociological analysis that compares major vegetation communities within the park in relation to their ecological heterogeneity. In this context, the present study aims to (i) quantify and compare the phytosociological characteristics of major ecosystem types within KLNP, and (ii) assess species diversity patterns using standard diversity indices. The novelty of this work lies in its systematic, quantitative comparison of vegetation communities across contrasting microhabitats within KLNP, providing a more rigorous ecological baseline than previously available studies. This approach also integrates diversity metrics with spatial patterns, offering improved ecological insight relevant to habitat management and conservation of the critically endangered Rucervus eldii eldii.
Methodology
Study Area
The present study was done in KLNP, Manipur, a space of low lying bogs found in the south-eastern part of Loktak lake between 93°48′E - 93°52′E longitudes and 24°26′N - 24°32′N latitudes in the Indo-Burma area of the Barak-Chindwin River bowl. The KLNP is divided from the lake by an irregular slope range known as Thanga Hills. The park's total area is 40 km², of which 26 km² is phumdi, and 14 km² comprises hillocks with small woodlands, raised portions of land that typically get submerged during enormous floods 5. The pH of the soil in the phumdi ranges from 5.2 to 6.0. During summer, the temperature goes from 11°C to 31.2°C, and the precipitation goes from 38.8 mm to 194.2 mm. During winter, the temperature ranges from 5°C to 28°C, while the rainfall from 6.8 mm to 77.9 mm. The yearly precipitation is 1460 mm. The humidity is most noteworthy during August, up to 81%, and at least 49% in March 11.
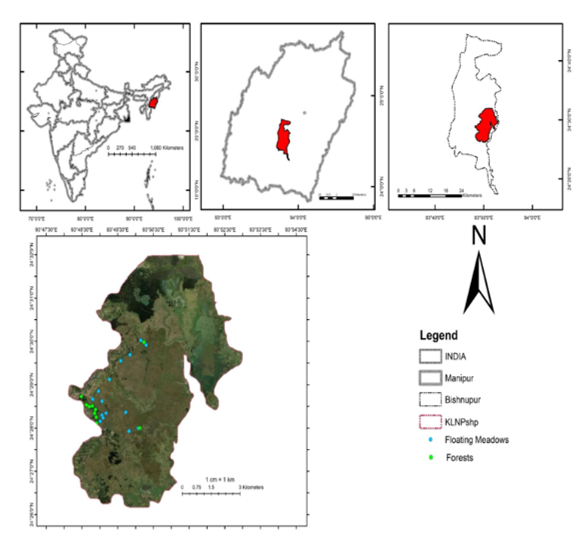
Fig. 1: The map shows the study area at different spatial scales: (a) India, (b) Manipur state boundary, (c) Bishnupur district, and (d) the detailed map of Keibul Lamjao National Park (KLNP) indicating the sampling locations.
Sampling and Data collection
The prior information on ecosystem types of the park, its flora and fauna, were assembled from the Wildlife Division, Park and Sanctuaries, Forest Department, Government of Manipur. The fieldwork was carried out during March-April 2021. For vegetation analysis of wetland ecosystems, data collected from 5 sites viz., fringe and internal area of Toya; peripheral region and interior location of Pabot; and the region around 500 m apart from the watchtower (fig. 1). Quantitative characters like frequency, density, and abundance were analyzed using 3m x3m quadrats with a sampling frequency of 10 quadrats per site. In contrast, for the terrestrial ecosystem, a total of 5 sample plots were randomly laid. The diverse vegetation composition inside the plots subjected to quantitative study through quadrat size of 31.62 m × 31.62 m (0.1 ha) size. All individuals inside the quadrat having >10 cm diameter at breast height (DBH) were measured at 1.37 m above the ground. All grass, herbs, shrubs, and tree species were identified with the assistance of a local key informant and local staff working in the park.
Data analysis
The collected field information was subjected to quantitative examination for their phytosociological characters and diversity indices. Vegetation analysis was performed to determine basal area, density, abundance, frequency, relative density, relative abundance, relative frequency, relative basal area, and Importance Value Index (IVI) 12, 13. IVI is indispensable to get a general picture of the ecological significance of a species regarding community structure. The Importance Value Index (IVI) of a species mirrors the dominance in a population. The following formulae were used:
Density =Total number of individuals of a speciesTotal number of quadrats studied
Frequency (%) =Total number of quadrats in which species occurTotal number of quadrats studiedx 100
Abundance =Total number of individuals of a species in all quadratsTotal number of quadrats in which the species occurs
Basal Area =Circumference square4?
Relative Density (RD)(%) =Total number of individuals of a speciesTotal number of Individuals of all speciesx 100
Relative Frequency (RF)(%) =Total number of occurrences of a speciesTotal number of occurrences of all speciesx 100
Relative Basal area (RBA)(%) =Basal area of individual speciesTotal basal area of all speciesx 100
Relative abundance (RA)(%) =Abundance of the individuals of a speciesTotal abundance of the individuals of all speciesx 100
IVI = RF + RD + RA (for wetland ecosystem)
IVI = RF + RD + RBA (for terrestrial ecosystem)
The biodiversity indices were calculated by applying the equations given in Table 1.
Table 1: The biodiversity indices
| Diversity attributes | Formula | Reference |
|---|---|---|
| Shannon-Wiener's diversity index | H = - Σ (Pi ln Pi) | Michael, (1984) 14 |
| Shannon's maximum diversity index | Hmax = ln(S) | Kent, (2011) 15 |
| Margalef's species richness index | R = (S - 1) / ln(N) | Margalef, (1957) 16 |
| Simpson's diversity index | D = Σ PiPi | Magurran, (1988) 17 |
| Dominance of Simpson's index | D' = 1 - D | Magurran, (1988) 17 |
| Species evenness index | E = H / ln(S) | Pielou, (1966) 18 |
Where N = Total number of individuals in the samples; Pi = number of individuals of ith species/total number of individuals in the samples; S = Total Number of species; n = Total Number of individuals of a species.
Results and Discussion
A total of 44 plant species belonging to 20 families in the wetland ecosystem and 26 tree species belonging to 17 families in the terrestrial ecosystem were recorded. In light of the Importance Value Index (IVI), the most dominant species in wetland environment were Zizania latifolia (13.69), Phragmites karka (12.33), Alpinia galanga (11.98), Oenanthe javanica (11.21), Hedychium coronarium (10.72), Saccharum spontaneum (10.64), Centella asiatica (9.77), Arundo donax (9.74), Erianthus arundinaceus (8.75), Cynodon dactylon (8.38), and Saccharum munja (8.36). In the Terrestrial ecosystem, the most dominant species were Pinus kesiya (74.90), Quercus serrata (29.49), Gmelina arborea (14.83), Lithocarpus fenestratus (14.58), Mallotus phillipensis (14.17), Enterolium cyclocarpum (11.84), Aegle marmelos (9.82), Bauhinia purpurea (9.63), Terminalia chebula (9.39), and Litsea polyantha (9.06). The major dominant plant species in both the ecosystems arerepresented by Fig. 2 & 3; and the biological diversity indices in both the ecosystems are presented in Table 2. The dominant grass species (P. karka, S. spontaneum, Z. latifolia), and herb species (O. javanica and H. coronarium) were the notable plant species of the wild ungulates of the Park 11. The dominance of poaceae mirrored the comparatively better performance of grasses which may be the effect of burning. Various biotic impacts make the plants overwhelming sites, draw energy from the underground rhizome and root framework as found in our investigation like the perennials and the life-forms with generally more prolonged and vigorous rhizomes 9. It has been observed that intense competitors develop well under grazing pressure and frequent burning 19. The IVI values in the terrestrial ecosystem show that the community is overwhelmed by Pinus kesiya and Quercus serrata because of its more prominent number of individuals, distribution and coverage in the park. Higher IVI values in P. kesiya, and Q. serrata is also significantly contributed by their higher relative basal area. Higher IVI values in Gmelina arborea and Lithocarpus fenestratus might be because of its higher close basal area; however, it has fewer tree individuals. Thus, the basal area is a significant factor in deciding the dominance of a species in the forest stand 20. The higher IVI values and predominance of P. kesiya and Q. serrata demonstrate that these species have a more aggressive capacity to endure and out-compete with other tree species present locally. It also may result from more structural quality through which they can smother others and have a better capacity to take up the nutrients than other trees in the area, which made them prevailing 21. The four tree species viz., P. kesiya, Q. serrata, Schima wallichi, Ficus sp. have also been reported to be the dominant species in the sacred groves of Manipur 22.
Table 2: Importance Value Index (IVI) and biological diversity indices in the Wetland and Terrestrial ecosystem
| Vegetation Attributes | Wetland Ecosystem | Terrestrial Ecosystem |
|---|---|---|
| Highest Important Value Index (IVI) species | Zizania latifolia (13.69) | Pinus kesiya (74.90) |
| Shannon-Wiener's Diversity Index (H) | 3.61 | 2.67 |
| Shannon's Maximum Diversity Index (Hmax) | 3.78 | 3.25 |
| Margalef's Species Richness Index (R') | 4.63 | 4.37 |
| Simpson's Diversity Index (D) | 0.03 | 0.12 |
| Dominance of Simpson's Index (D') | 0.96 | 0.87 |
| Species Evenness Index (E') | 0.952 | 0.82 |
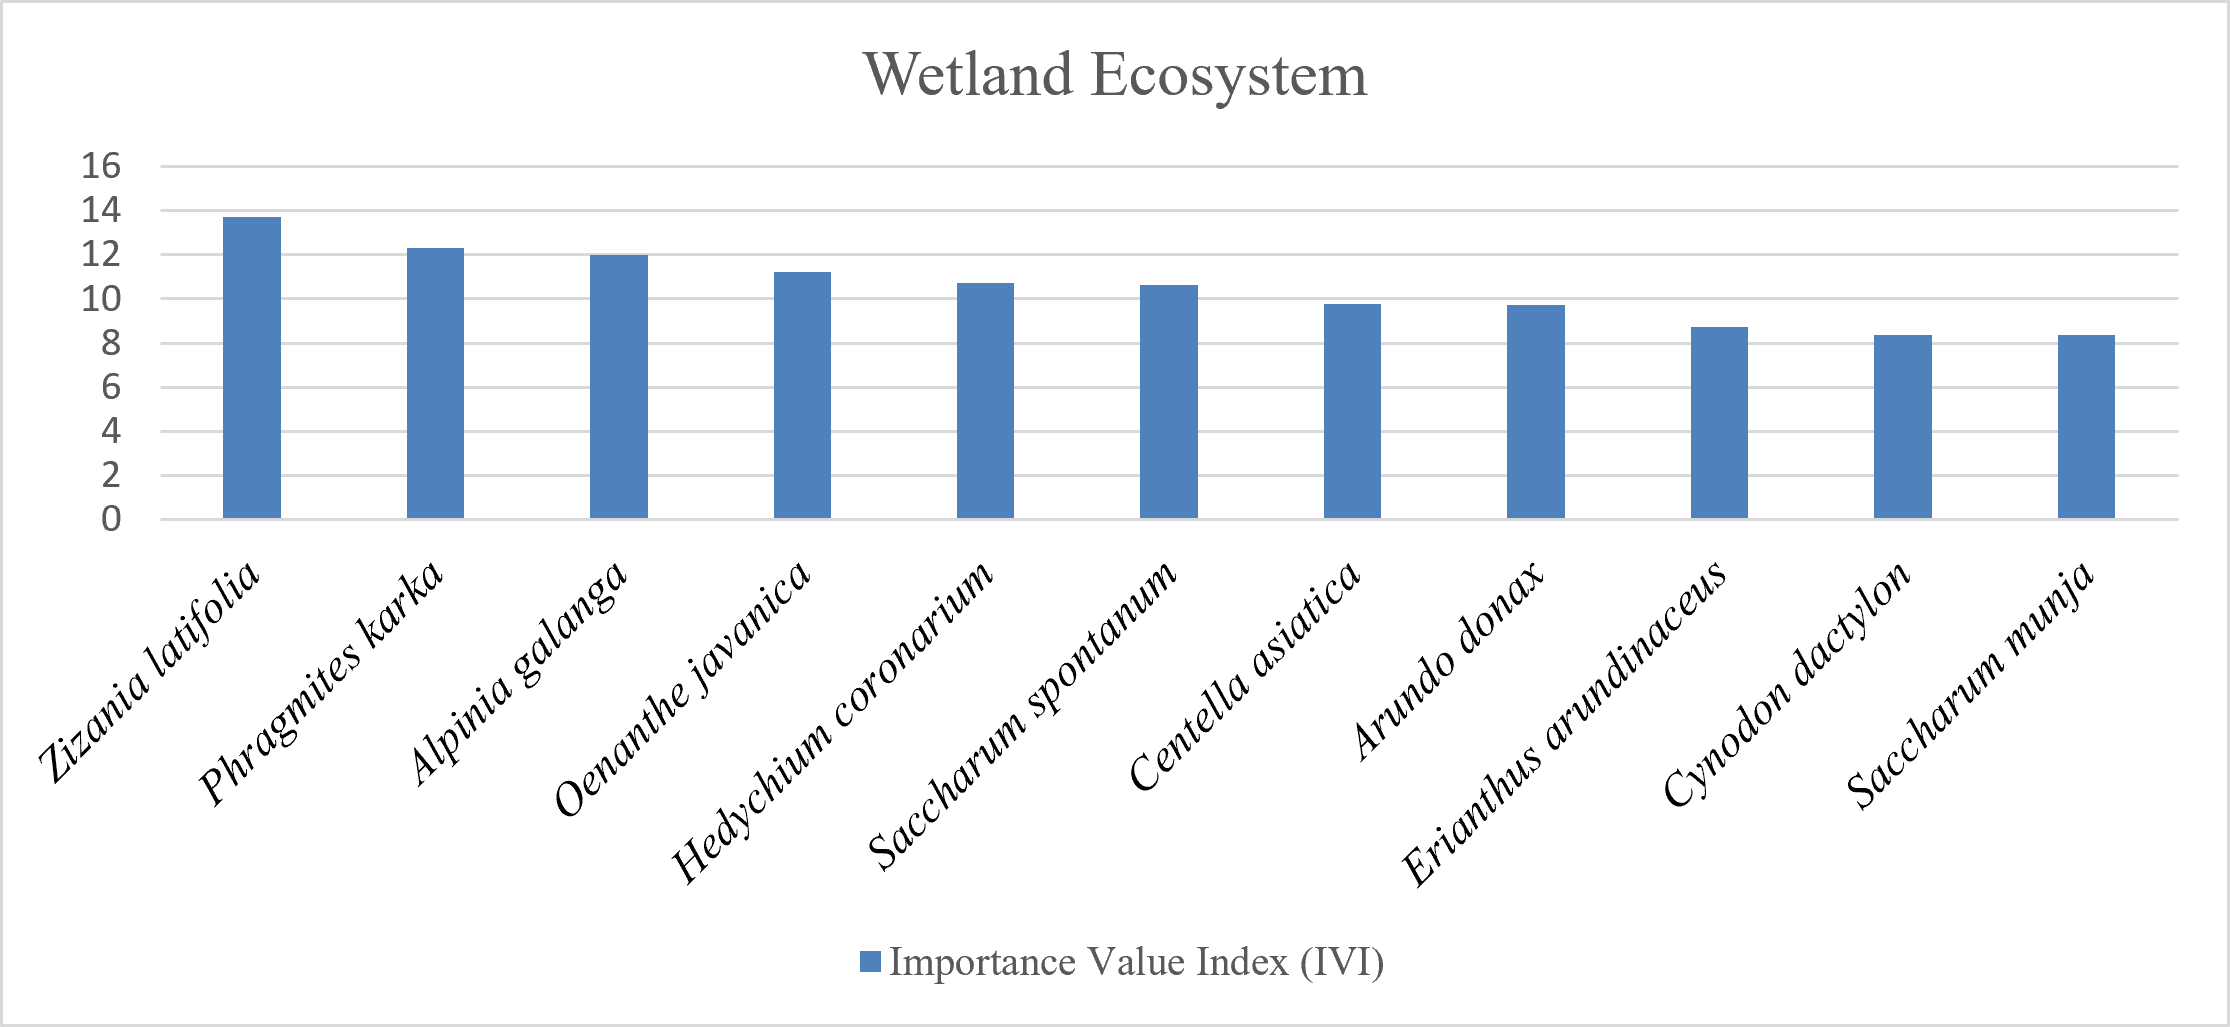
Fig. 2: Most dominant plant species in the Wetland ecosystem
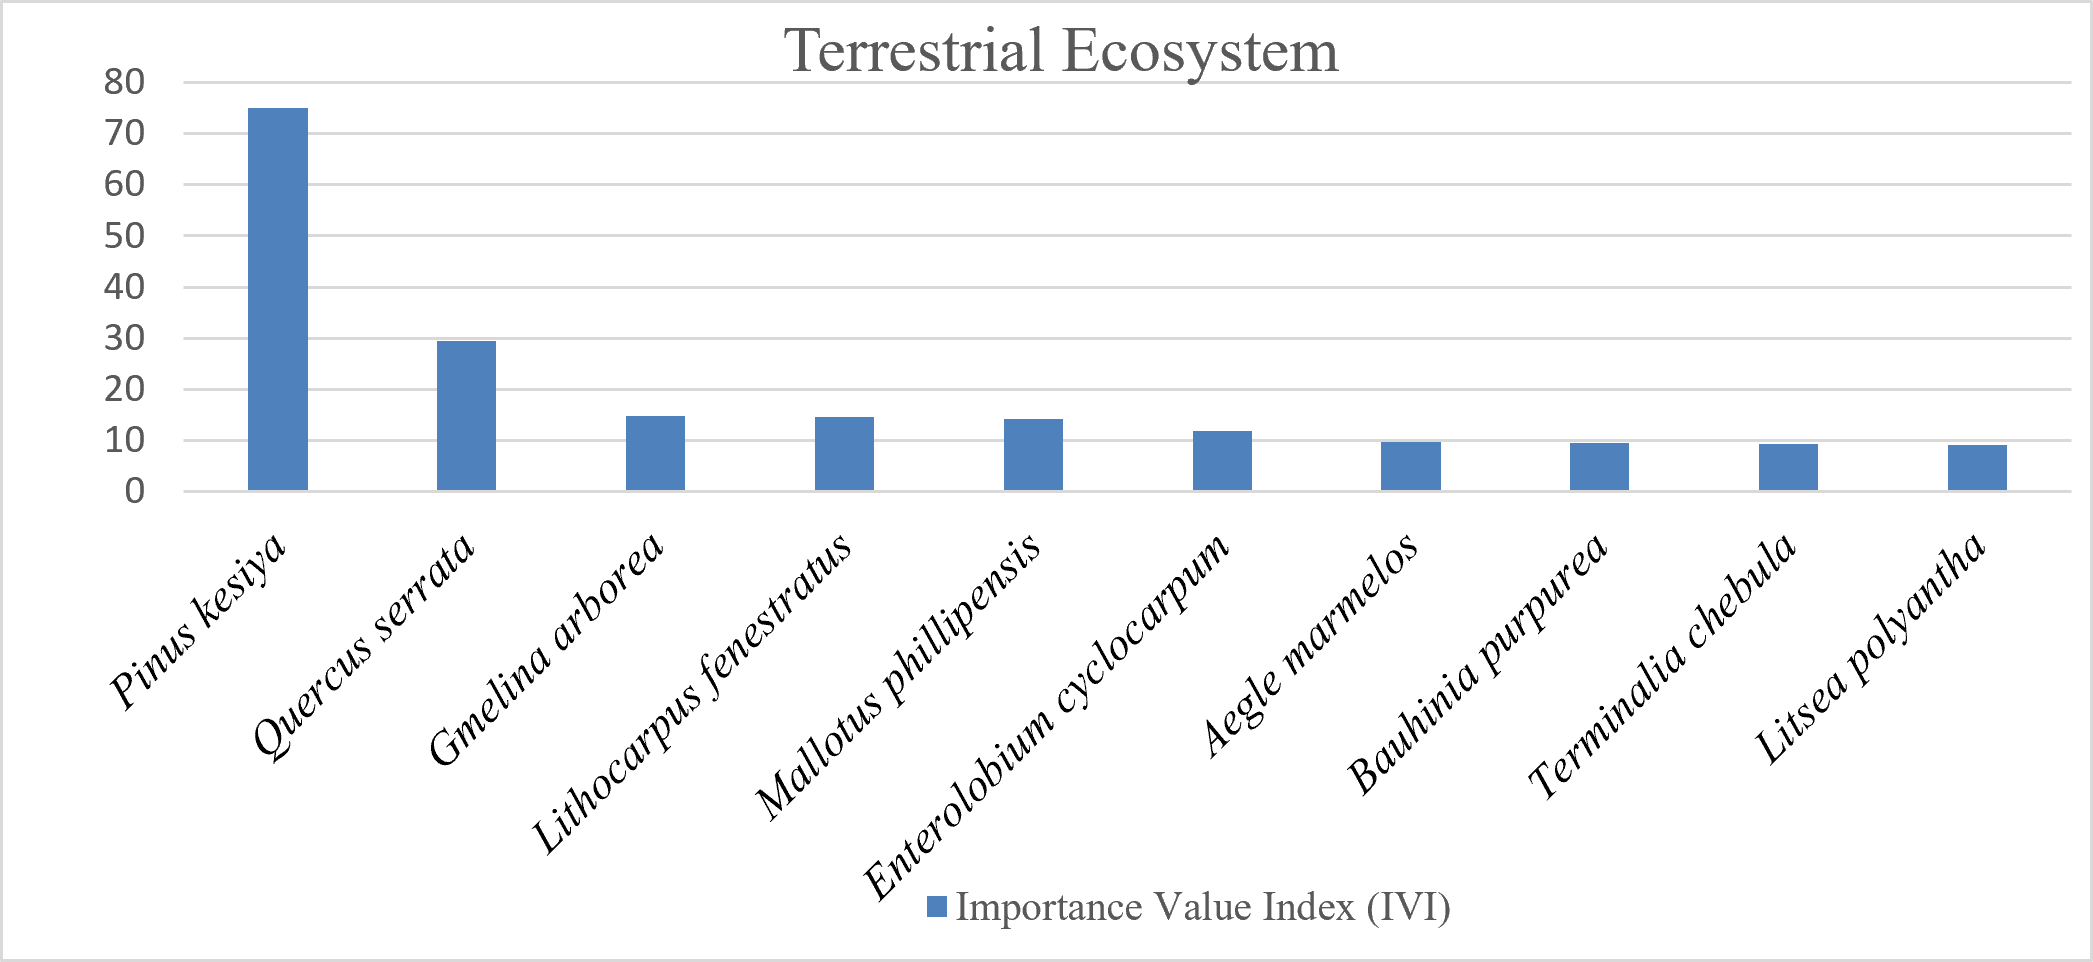
Fig. 3: Most dominant plant species in the terrestrial ecosystem
The Shannon-Wiener's Diversity Index (H) value of Wetland and Terrestrial ecosystems were 3.61 and 2.67, respectively. Angom and Gupta 9 have also reported an H index range of 1.41-3.26 in the floating meadows of the park whereas, Khumbongmayum et al. 22 reported H value in the range of 2.22-3.17 in four selected sacred groves of Manipur valley. The Shannon's Maximum Diversity Index (Hmax) values showed higher diversity in the wetland ecosystem (3.78) than the terrestrial ecosystem (3.25). The Simpson's Diversity Index (D) of the wetland ecosystem and terrestrial ecosystem were 0.03 and 0.12. Thus, there is more remarkable diversity in the wetland ecosystem as the value of D was close to zero. The Dominance of Simpson's Index (D') of 0.96 in the wetland ecosystem was very near to the most extreme predominance value (1), while the Value of D' was 0.87 in the terrestrial ecosystem. The higher Dominance of Simpson's Index (D') recorded in the wetland ecosystem is attributed to a higher number of individuals and species. The value of dominance of Simpson's Index (0.87) recorded in the terrestrial ecosystem might be because of the more significant number of individuals and the occurrence of P. kesiya when compared with other individual tree species. The Dʹ with a more superior value indicates more remarkable sample diversity where the highest index value is 1 17. The higher variety found in the phumdi of KLNP was ascribed to mosaic/heterogeneous habitat affected by different factors such as favorable climatic conditions, high nutrients available, grazing by ungulates, and burning. Such interaction in the habitat allows a more prominent diversity of particular species to co-exist 23.
The Pielou's Species Evenness Index (E) value recorded in the two ecosystems, i.e., 0.95 and 0.82, shows less variation between the species in both ecosystems. The Pielou's Species Evenness Index (E) in wetland biological system display almost complete species evenness. Species Evenness index (E) value lies between 0 and 1, where 1 is total equity 18. The Margalef's species richness value (4.63) in the wetland ecosystem designates the presence of a more significant number of species in a community than the terrestrial ecosystem (4.37). The Margalef's Species Richness Index (R) is more remarkable in a community that incorporates a more significant number of species 16. Tuboi and Hussain 5 have reported species richness of the floating meadows in the range of 3.8 to 8.3 in summer, while in winter, it ranged from 2.1 to 7.8. Meetei et al. 20 reported a species richness value of 3.61-5.33 in the subtropical mixed broad-leaved forests of Senapati district, Manipur.
The observed vegetation composition and diversity patterns in both wetland and terrestrial ecosystems of KLNP reflect underlying ecological processes driven by hydrology, disturbance regimes, and nutrient availability. The dominance of poaceae members in the wetland ecosystem indicates a system strongly regulated by periodic flooding, grazing pressure, and fire, which collectively favor fast-growing, rhizomatous species with high regenerative capacity. Such species are well adapted to fluctuating water regimes and contribute significantly to rapid biomass turnover and nutrient cycling in the floating meadow system 24, 25. In contrast, the terrestrial ecosystem is structurally dominated by long-lived woody species such as Pinus kesiya and Quercus serrata, indicating a comparatively stable successional stage with strong competitive interactions for light and soil resources 26, 27. The higher Importance Value Index (IVI) of these species reflects their ecological efficiency in resource acquisition and their ability to shape forest stand structure.
The higher diversity and evenness observed in the wetland ecosystem suggest a heterogeneous habitat mosaic created by variations in water depth, nutrient gradients, and disturbance intensity 19, 28. This spatial heterogeneity promotes coexistence of multiple functional plant groups, thereby enhancing overall ecosystem productivity and resilience. Conversely, lower diversity but higher dominance in the terrestrial ecosystem indicates a more structured community with competitive exclusion dynamics 21, 20. From a habitat management perspective, these patterns highlight the ecological significance of maintaining hydrological regimes and disturbance processes such as controlled grazing and natural flooding in sustaining wetland biodiversity 5. The strong association between dominant grass species and herbivores further underscores the role of vegetation composition in regulating trophic interactions and habitat suitability for the endangered Rucervus eldii eldii 28, 11, 5. Therefore, vegetation structure in KLNP is not only a reflection of environmental conditions but also a key driver of ecosystem functioning, carbon dynamics, and wildlife habitat quality.
The observed changes in vegetation composition in the floating meadow ecosystem have direct implications for the conservation of Rucervus eldii eldii (Sangai). The dominance of grass species such as Phragmites karka, Zizania latifolia, and Saccharum spontaneum is ecologically important, as these form the primary forage base for Sangai and strongly influence habitat quality 19, 5. However, shifts in species composition driven by hydrological alteration and disturbance may reduce forage diversity and alter habitat suitability. Phumdi degradation, particularly thinning and reduced mat thickness, further threatens habitat stability. Since Sangai depend on sufficiently thick phumdi for movement and support, continued degradation can directly reduce habitat carrying capacity and increase vulnerability of the population. Fragmentation of phumdi patches due to fluctuating water levels and anthropogenic pressures may also disrupt habitat connectivity. These findings highlight the need to maintain native grass-dominated communities and stable hydrological conditions to ensure suitable habitat for Sangai. Conservation measures such as regulating water regimes, controlling invasive species, and preventing excessive biomass removal are essential to sustain phumdi integrity and long- term habitat functionality.
Conclusion
A strong understanding of ecosystem types, wildlife habitats, floristic composition, and biodiversity is crucial for the survival of Eld's deer (Sangai). The dominance of grasses (Poaceae) suggests effective habitat management aimed at maintaining suitable food and shelter while controlling invasive species. The prevalence of P. kesiya and Q. serrata indicates their competitive resilience in terrestrial ecosystems. High diversity in the phumdi of KLNP likely results from habitat heterogeneity shaped by grazing and controlled burning. Despite the availability of diverse forage, scientific management of dense phumdi and tall grasslands is essential for the long-term survival of the species. A reassessment of past conservation strategies, along with stronger collaboration among stakeholders, is urgently needed to develop an effective, science-based management plan.
Acknowledgments
The authors thank the authorities of KLNP for granting permission to conduct the study and co-operation during the fieldwork and acknowledge the Department of Science & Technology, Govt. of India for financial assistance in the form of INSPIRE fellowship (grant No.IF190374).
Declaration
The authors declare that they have no conflict of interest.
References
[1]Meusch, E., Yhoung-Aree, J., Friend, R., & Funge-Smith, S.J. (2003).The role and nutritional value of aquatic resources in the livelihoods of rural people- a participatory assessment in Attapeu Province, Lao PDR. Food and Agriculture Organization of the United Nations Regional Office for Asia and the PacificBangkok, Thailand. pp. 34.
[2]Bezuijen, M.R., Phothitay, C., Chanrya, S., Rasphone, A., & Hallam, C.D. (2007). Wetland resource use in XE Plan National Protected area, Lao PDR, in 2005. Natural History Bulletin of the Siam Society, 55:223–234.
[3]Nath, A.J., & Lal R. (2017). Managing tropical wetlands for advancing global rice production: Implications for land- use management. Land Use Policy, 68:681–685. https://doi.org/10.1016/j.landusepol.2017.08.026.
[4]Zedler, J.B., &Kercher S. (2005). Wetland resources: Status, trends, ecosystem services, and restorability. Annual Review of Environment and Resources, 30:39–74.https://doi.org/10.1146/annurev.energy.30.050504.144248.
[5]Tuboi, C., & Hussain, S.A. (2018). Plant community structure of the floating meadows of a hypereutrophic wetland in the Indo-Burma Biodiversity Hotspot. Aquatic Botany, 150:71–81. https://doi.org/10.1016/j.aquabot.2018.06.006.
[6]Ashley, G.M., Goman, M., Hover, V.C., Owen, R.B., Renaut, R.W., & Muasya, A.M. (2002). Artesian blister wetlands, a perennial water resource in the semi-arid RIFT Valley of East Africa. Wetlands, 22:686–695.
[7]Ruto, W., Kinyamario, J., Ng'etich, N., Akunda, E., & Mworia J. (2012). Plant species diversity and composition of two wetlands in the Nairobi National Park, Kenya. Journal of Wetlands Ecology, 6:7–15. https://doi.org/10.3126/jowe.v6i0.5909.
[8]Southall, E.J., Dale, M.P., & Kent M. (2003). Spatial and temporal analysis of vegetation mosaics for conservation: Poor fen communities in a Cornish valley mire. Journal of Biogeography, 30:1427–1443. https://doi.org/10.1046/j.1365-2699.2003.00924.x.
[9]Angom, D., & Gupta, A. (2012). Phytodiversity analysis of keibul lamjao national park with a note on productivity. In: Symposium proceedings on biodiversity status & conservation strategies with reference to NE India.Department of Life Sciences, Manipur University, Imphal, pp. 53–60.
[10]Brown, L.R., Dupreez, P.J., Bezuidenhout, H., Bredenkamp, G.J., Mostert, T.H.C., & Collins N.B. (2013). Guidelines for phytosociological classifications and descriptions of vegetation in southern Africa. Koedoe, 55:1–10. https://doi.org/10.4102/koedoe.v55i1.1103.
[11]Tuboi, C., & Hussain, S.A. (2016). Factors affecting forage selection by the endangered Eld's deer and hog deer in the floating meadows of Barak-Chindwin Basin of North-east India. Mammalian Biology, 81:53–60. https://doi.org/10.1016/j.mambio.2014.10.006.
[12]Phillips, E.A. (1959). Methods of Vegetation Study. Holt, Rinehart and Winston, New York, pp. 107.
[13]Curtis, J.T., & McIntosh, R.P. (2013). The interrelations of certain analytic and synthetic phytosociological characters. Ecological Society of America Stable, 31:434–455.
[14]Michael, P. (1984). Ecological methods for field and laboratory investigations. Tata Mc Graw Hill Publishing Co. Ltd., New Delhi, India, pp. 3334–6666.
[15]Kent, M. (2011). Vegetation description and data analysis: A practical approach. John Wiley & Sons, New York, pp. 167–169.
[16]Margalef, R. (1957). Information theory in ecology. General Systems, 3:36–71.
[17]Magurran, A.E. (1988). Ecological diversity and its measurement. Princeton university press, Princeton, New Jersey, pp. 354.
[18]Pielou, E. (1966). Species-Diversity and Pattern-Diversity in the study of ecological succession. Journal of theoretical biology, 10:370–383. https://doi.org/10.1016/0022-5193(66)90133-0.
[19]Daisy, A. (2005). Ecological studies of vegetation in Keibul Lamjao National Park Manipur. Ph.D. Thesis, Manipur University, Imphal.
[20]Meetei, S.B., Das, A.K., & Singh, E.J. (2017). Tree species composition and diversity in subtropical forest of Manipur, North-East India. Indian Forester, 143:1169–1176.
[21]Kumar, K.S., Benjongwapang, A., Khanduri, V.P., Gautam, P.K., Singh, D. & Singh, S.K. (2013). Assessment of soil nutrients (N, P, and K) status along with tree diversity in different land-use systems at Mokokchung, Nagaland, India. Science and Technology Journal, 1:42–48.
[22]Khumbongmayum, A.D., Khan, M.L., & Tripathi, R.S. (2005). Sacred groves of Manipur, northeast India : biodiversity value, status, and strategies for their conservation. Biodiversity & Conservation, 14: 1541–1582. https://doi.org/10.1007/s10531-004-0530-5.
[23]Gupta, A., & Angom D. (2006).Vegetational analysis of grasslands in Keibul Lamjao National Park, Manipur. International Journal of Ecology, Environment and Conservation, 12:453–464.
[24]Ma, Q., Zhang, C., Chen, L., Yao, M., Yang, F., Yan, H., & Li, W. (2023). Carbon Dioxide Fluxes and Influencing Factors in the Momoge Salt Marsh Ecosystem, Jilin Province, China. Applied Sciences (Switzerland), 13:20. https://doi.org/10.3390/app132011604
[25]Tak, D. B. Y., Vroom, R. J. E., Lexmond, R., Lamers, L. P. M., Robroek, B. J. M., & Temmink, R. J. M. (2023). Water level and vegetation type control carbon fluxes in a newly-constructed soft-sediment wetland. Wetlands Ecology and Management, 31(4):583–594. https://doi.org/10.1007/s11273-023-09936-1
[26]Zhang, H., Wang, K., Xu, X., Song, T., Xu, Y., & Zeng, F. (2015). Biogeographical patterns of biomass allocation in leaves, stems, and roots in Chinas forests. Scientific Reports, 5:1–12. https://doi.org/10.1038/srep15997
[27]Wang, X., Chen, X., Xu, J., Ji, Y., Du, X., & Gao, J. (2023). Precipitation dominates the allocation strategy of above- and belowground biomass in plants on macro scales. Plants, 12(15): 2843. https://doi.org/10.3390/plants12152843
[28]Tuboi, C., Angom, S., Babu, M. M., Badola, R., & S.A., H. (2012). Plant species composition of the floating meadows of Keibul Lamjao National Park, Manipur. NeBio, 3:1–11.